FAQ: General
Will your indicators work on all versions of MotiveWave ?
Yes, absolutely. On Linux, MacOS and Windows versions even.
But keep the following in mind:
(from the official MotiveWave website; click on any of the ‘?’ behind “Java SDK” )
- For the Community, Standard, Order Flow, and Elliott Wave Lite Editions, (because they don’t have any strategy backtesting functionality), you only have the ability to test custom studies/indicators. You can still code strategies within the SDK, but there would be no way for you to test them in the Standard, Trade, or Elliott Wave Lite Editions.
- For the Professional and Ultimate Editions, you have the ability to test your Java SDK-built custom studies/indicators AND strategies.
When will the studies expire ?
Contrary to what you may encounter elsewhere, our studies are NOT licensed for only a certain period of time. Once you buy them, you can use them forever. And a day.
Which payment methods do you offer ?
We’ve decided to use SendOwl for our digital downloads.
This means you can pay with PayPal, credit card or Bankcontact (EU).
But Apple Pay, Alipay, EPS, Giropay, iDEAL, Multibanco and Przelewy24 are also possible.
Please reach out to info@vb6.systems if you are looking for another way to pay.
FAQ: Importing Studies & Strategies into MotiveWave
How do I add a purchased study or strategy to my MotiveWave ?
- Once you have paid for a study -take the SwingIndicator for example- you will be offered the option to download it.
- Save the file (it will have a .jar extension) locally on your system
- Open up your MotiveWave
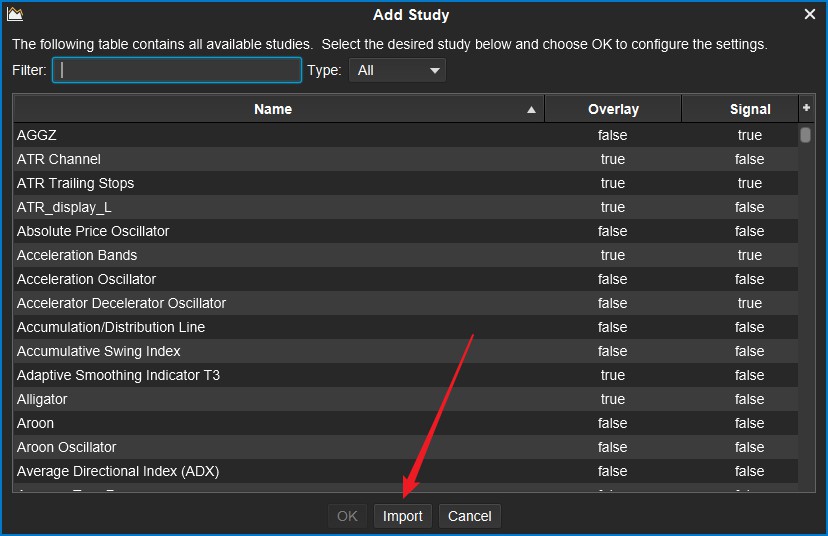
- Browse the ‘Study’ menu (if you purchased a Study) or to the ‘Strategy’-menu (if you purchased a Strategy) and select the first entry: ‘Add Study’ (or ‘Add Strategy’)
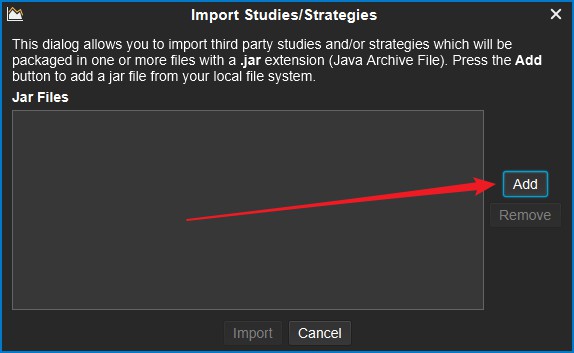
- A pop-up window will open. Select ‘Import’ at the very bottom.
- Browse to the location of the .jar file you saved locally.
- The study is now imported into your MotiveWave.
- Close the ‘Add Study’ or ‘Add Strategy’ menu
- Browse to the ‘Study’ (or ‘Strategy’) menu once more and look for the ‘VB6.systems’-subfolder. You will find the your shiny new Study or Strategy there !
- Remember that most of our Studies / Strategies are protected. You will be able to import them, but you will only be able to use them if you provided us with the correct email-address your MW-platform is licensed to.
You can find this address by heading over to MW’s ‘Help’-menu and clicking ‘About’.
Mail to info@vb6.systems if you have further questions.
FAQ: SwingIndicator
How many instances of the SwingIndicator can I use at the same time ?
here is no limit to the number of SwingIndicators you can add to a single chart.
Likewise, there is no limit for the number of charts you can add the SwingIndicator to.
So, please feel free to add 5 SwingIndicators to 50 charts 😎
(actually: the only limiting factor would be the processing power and memory of your computer system)
I notice that the SwingIndicator is plotting markers that are ‘unnecessary’ or even wrong on new bars.
Because of the SwingIndicator’s internal workings, the following is possible when a bar is completed (in real time):
- NO new swing high or swing low is being discovered, so the study will plot the markers for the last Swing High/Low. When a ‘new swing’ is discovered, the study plots it (over the last X bars in the past).
It is therefore possible that a single bar has more than one marker above or below it.
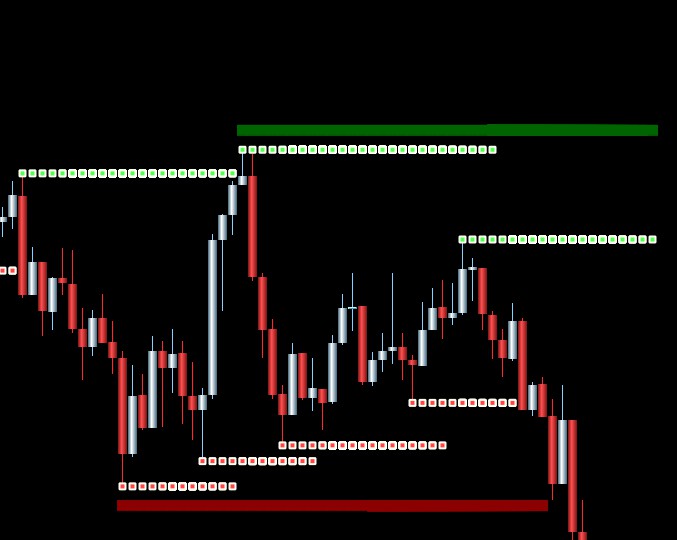
The example below shows this option for a Swing 5, and a higher level Swing 25.
- X bars (where X is equal to the SwingStrength you chose) have been completed since the last Swing High/Low, and the study notices that the bar that was completed X bars ago was indeed a Swing High/Low. The study then ‘forgets’ that last Swing High/Low and starts drawing markers on the new High/Low level. The ‘old’ markers (that were drawn for the ‘old’ Swing High/Low) will however still be visible on the chart.
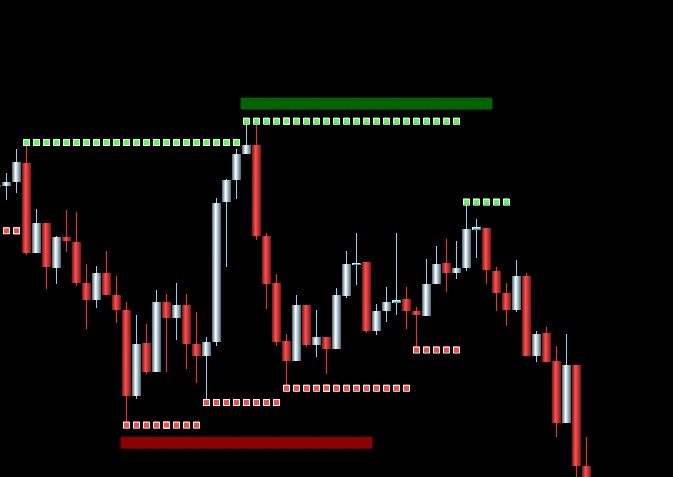
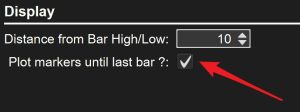
The example below has the option ‘plot markers until last bar’ turned OFF for both the Swing 5 & the Swing 25.
Notice the difference ?
- As mentioned, should you prefer not to experience this behavior, you can simply turn the ‘realtime drawing of the markers for the current Swing High/Low’ off in the study’s settings panel:
- The markers for an ‘old Swing’ will still be drawn then, but ONLY after a new one has been found.
FAQ: Not found !
Your specific question has not yet been answered after ploughing through everything above ?
Please reach out to info@vb6.systems and we will be happy to assist 🙂
